Previous
Bayesian Methods
Contents
Table of Contents
Next
Gaussian Process

7.3.3. Bayesian Network

Bayesian network, also known as Bayes network, belief network, Bayes net, or decision network, further loosens the assumption of inter-dependencies [62]. For this purpose, a Directed Acyclic Graph (DAG) is adopted to describe the dependency relationship between attributes. Thus, a Bayesian network is a probabilistic graphical model that represents a set of variables and their conditional dependencies via DAG. In addition, Conditional Probability Tables (CPT) are employed to describe the joint probability distribution of attributes.
Bayesian networks are suitable for predicting the probabilities of events as outcomes of the factors that can cause such events. For example, Bayesian networks can be used to learn the probabilistic relationships between diseases and symptoms and predict the diseases based on the symptoms.
We will show how to use a Bayesian network to predict the joint probability, i.e., P ( x i c ) = P ( x i 1 , x i 2 , , x i J c ) P x i c = P x i 1 , x i 2 , , x i J c P( vec(x)_(i)∣c)=P(x_(i1),x_(i2),cdots,x_(iJ)∣c)P\left(\vec{x}_{i} \mid c\right)=P\left(x_{i 1}, x_{i 2}, \cdots, x_{i J} \mid c\right)P(xic)=P(xi1,xi2,,xiJc). For this purpose, we will first introduce the basic structure of the Bayesian network. Then, we will use one example to show how to predict the joint probability. Next, we will show the implementation of the Bayesian network. Coding Bayesian networks, as well as using such code, could be complicated and trivial. Possibly due to this reason, it is not provided in common machine packages like Scikit-learn. We will show the implementation of Bayesian using another package: pgmpy [63]. The implementation of the Bayesian network on three levels will be introduced: 1. manually constructing the network structure and entering the parameters (CPTs), 2. autonomously obtaining the parameters by training the network with training data, and 3. autonomous search for the optimal network structure.

Structure

The structure of Bayesian networks needs to be understood from two relevant aspects: basic units and interdependencies. Fig. 7.3 shows the three basic units in typical Bayesian networks: tail-to-tail, head-to-tail, and head-to-head.
Figure 7.3: Three basic units in typical Bayesian networks
These three basic units can indicate the following interdependencies:
  • Common Cause: If C C CCC is known, A A AAA and B B BBB are independent. This is written as ( A B C ) ( A B C ) (A _|_ B∣C)(A \perp B \mid C)(ABC)
  • Causal/Evidential: If C C CCC is known, A A AAA and B B BBB are independent. This is written as ( A B C ) ( A B C ) (A _|_ B∣C)(A \perp B \mid C)(ABC)
  • Common Evidence: If C C CCC is unknown, A A AAA and B B BBB are independent. Or, If C C CCC is known, A A AAA and B B BBB are not independent. This is written as ( A ⊥̸ B C ) ( A ⊥̸ B C ) (A⊥̸B∣C)(A \not \perp B \mid C)(A⊥̸BC)
    The above interdependencies can be used to calculate the joint probabilities using the following equation.
(7.34) P ( x i c ) = P ( x i 1 , x i 2 , , x i J c ) = j = 1 J P ( x i j c , parents ( x i j ) ) (7.34) P x i c = P x i 1 , x i 2 , , x i J c = j = 1 J P x i j c ,  parents  x i j {:(7.34)P( vec(x)_(i)∣c)=P(x_(i1),x_(i2),cdots,x_(iJ)∣c)=prod_(j=1)^(J)P(x_(ij)∣c," parents "(x_(ij))):}\begin{equation*} P\left(\vec{x}_{i} \mid c\right)=P\left(x_{i 1}, x_{i 2}, \cdots, x_{i J} \mid c\right)=\prod_{j=1}^{J} P\left(x_{i j} \mid c, \text { parents }\left(x_{i j}\right)\right) \tag{7.34} \end{equation*}(7.34)P(xic)=P(xi1,xi2,,xiJc)=j=1JP(xijc, parents (xij))
where parents ( x i j ) x i j (x_(ij))\left(x_{i j}\right)(xij) are all the parent attributes. Thus, we need to consider the parent attributes of any attribute when computing the joint probability.
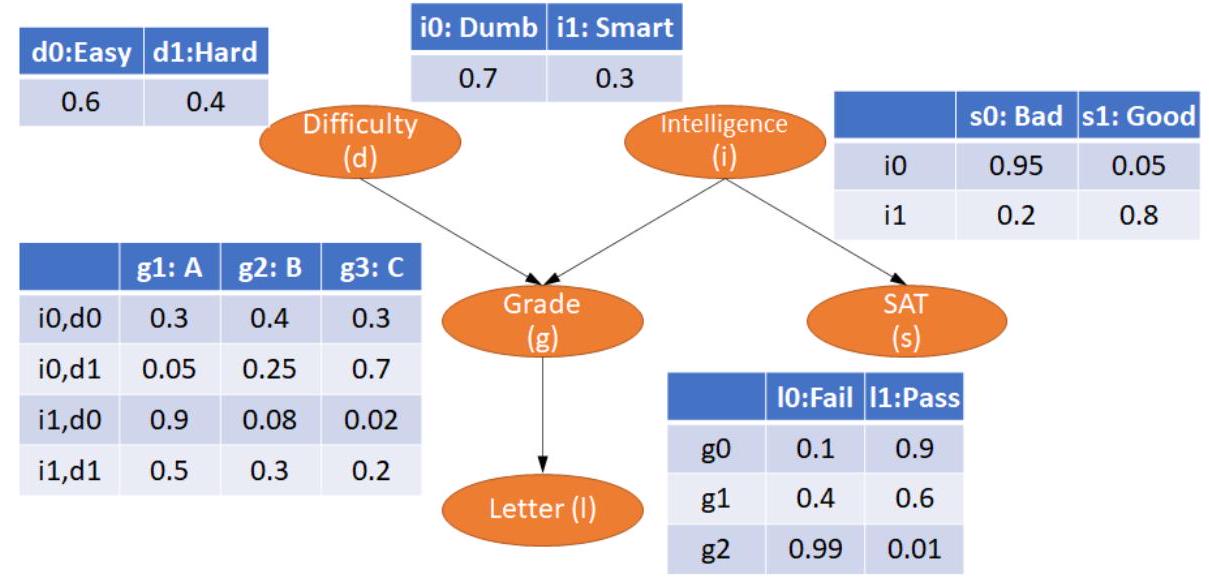
The use of this equation will be illustrated using the example in Fig. 7.4, which is frequently adopted for illustrating the application of the Bayesian network.
Figure 7.4: Example for using Bayesian networks
Without considering the interdependencies given in the above Bayesian network, the joint probability can be formulated as
(7.35) P ( D , I , G , L , S ) = P ( L S , G , D , I ) P ( S G , D , I ) P ( G D , I ) P ( D I ) P ( I ) (7.35) P ( D , I , G , L , S ) = P ( L S , G , D , I ) P ( S G , D , I ) P ( G D , I ) P ( D I ) P ( I ) {:(7.35)P(D","I","G","L","S)=P(L∣S","G","D","I)*P(S∣G","D","I)*P(G∣D","I)*P(D∣I)*P(I):}\begin{equation*} P(D, I, G, L, S)=P(L \mid S, G, D, I) \cdot P(S \mid G, D, I) \cdot P(G \mid D, I) \cdot P(D \mid I) \cdot P(I) \tag{7.35} \end{equation*}(7.35)P(D,I,G,L,S)=P(LS,G,D,I)P(SG,D,I)P(GD,I)P(DI)P(I)
Applying the local independence conditions in the above equation, we will get
(7.36) P ( D , I , G , L , S ) = P ( L G ) P ( S I ) P ( G D , I ) P ( D ) P ( I ) P ( G ) = D , I , L , S P ( L G ) P ( S I ) P ( G D , I ) P ( D ) P ( I ) (7.37) = D I L S P ( L G ) P ( S I ) P ( G D , I ) P ( D ) P ( I ) = P ( G D , I ) D P ( D ) I P ( I ) L P ( L G ) S P ( S I ) (7.36) P ( D , I , G , L , S ) = P ( L G ) P ( S I ) P ( G D , I ) P ( D ) P ( I ) P ( G ) = D , I , L , S P ( L G ) P ( S I ) P ( G D , I ) P ( D ) P ( I ) (7.37) = D I L S P ( L G ) P ( S I ) P ( G D , I ) P ( D ) P ( I ) = P ( G D , I ) D P ( D ) I P ( I ) L P ( L G ) S P ( S I ) {:[(7.36)P(D","I","G","L","S)=P(L∣G)*P(S∣I)*P(G∣D","I)*P(D)*P(I)],[P(G)=sum_(D,I,L,S)P(L∣G)*P(S∣I)*P(G∣D","I)*P(D)*P(I)],[(7.37)=sum_(D)sum_(I)sum_(L)sum_(S)P(L∣G)*P(S∣I)*P(G∣D","I)*P(D)*P(I)],[=P(G∣D","I)*sum_(D)P(D)*sum_(I)P(I)*sum_(L)P(L∣G)*sum_(S)P(S∣I)]:}\begin{align*} & P(D, I, G, L, S)=P(L \mid G) \cdot P(S \mid I) \cdot P(G \mid D, I) \cdot P(D) \cdot P(I) \tag{7.36}\\ & P(G)=\sum_{D, I, L, S} P(L \mid G) \cdot P(S \mid I) \cdot P(G \mid D, I) \cdot P(D) \cdot P(I) \\ &=\sum_{D} \sum_{I} \sum_{L} \sum_{S} P(L \mid G) \cdot P(S \mid I) \cdot P(G \mid D, I) \cdot P(D) \cdot P(I) \tag{7.37}\\ &=P(G \mid D, I) \cdot \sum_{D} P(D) \cdot \sum_{I} P(I) \cdot \sum_{L} P(L \mid G) \cdot \sum_{S} P(S \mid I) \end{align*}(7.36)P(D,I,G,L,S)=P(LG)P(SI)P(GD,I)P(D)P(I)P(G)=D,I,L,SP(LG)P(SI)P(GD,I)P(D)P(I)(7.37)=DILSP(LG)P(SI)P(GD,I)P(D)P(I)=P(GD,I)DP(D)IP(I)LP(LG)SP(SI)

Implementation

A Bayesian network can be constructed manually for the above example using the following code.
from pgmpy.models import BayesianNetwork # BayesianModel in old versions of pgmpy
              from pgmpy.factors.discrete import TabularCPD
              from pgmpy.inference import VariableElimination
              import networkx as nx
              import matplotlib.pyplot as plt
              # Define the Bayesian model structure using edges
              model = BayesianNetwork([('D', 'G'), ('I', 'G'), ('G', 'L'), ('I', 'S')])
              #-----------------------Enter probabilities manually -----------------------------------
              
# Define CPD
              cpd_d = TabularCPD(variable=' D', variable_card=2, values=[[0.6], [0.4]])
              cpd_i = TabularCPD(variable='I', variable_card=2, values=[[0.7], [0.3]])
              cpd_g = TabularCPD(variable='G', variable_card=3,
                values=[[0.3, 0.05, 0.9, 0.5],
                    [0.4, 0.25, 0.08, 0.3],
                    [0.3, 0.7, 0.02, 0.2]],
                evidence=['I', 'D'],
                evidence_card=[2, 2])
              cpd_l = TabularCPD(variable=' L', variable_card=2,
                values=[[0.1, 0.4, 0.99],
                        [0.9, 0.6, 0.01]],
                evidence=['G'],
                evidence_card=[3])
              cpd_s = TabularCPD(variable='S', variable_card=2,
                values=[[0.95, 0.2],
                        [0.05, 0.8]],
                evidence=['I'],
                evidence_card=[2])
              # Correlate DAG with CPDs
              model.add_cpds(cpd_d, cpd_i, cpd_g, cpd_l, cpd_s)
              #-----------------------------------------------------------------------------------------
              model.get_cpds()
              # Check the CPDs of different nodes
              for cpd in model.get_cpds():
                print("CPD of {variable}:".format(variable=cpd.variable))
                print(cpd)
              # Check the network structure and CPDs: valid if the total of CPD equals 1
              model.check_model()
              # Plot the Bayesian network
              nx.draw(model,
                        with_labels=True,
                        node_size=1000,
                        font_weight='bold',
                        node_color=' y',
                        pos={"L": [4, 3], "G": [4, 5], "S": [8, 5], "D": [2, 7], "I": [6, 7]})
              plt.text(2, 7, model.get_cpds("D"), fontsize=10, color='b')
              plt.text(5, 6, model.get_cpds("I"), fontsize=10, color='b')
              plt.text(1, 4, model.get_cpds("G"), fontsize=10, color='b')
              plt.text(4.2, 2, model.get_cpds("L"), fontsize=10, color='b')
              plt.text(7, 3.4, model.get_cpds("S"), fontsize=10, color='b')
              plt.title('test')
              plt.show()
              
In the above code, the parameters, i.e., CPDs, were entered manually. However, such parameters should be determined by data via training. Thus, when we have training data, we will need to obtain the parameters based on the structure and the training data. These parameters can be automatically obtained by fitting the model with a fixed structure to the training data. The following code illustrates this process.
from pgmpy.models import BayesianNetwork
              from pgmpy.factors.discrete import TabularCPD
              from pgmpy.inference import VariableElimination
              import networkx as nx
              from matplotlib import pyplot as plt
              from pgmpy.estimators.MLE import MaximumLikelihoodEstimator
              import numpy as np
              import pandas as pd
              raw_data = np.random.randint(low=0, high=2, size=(1000, 5)) # Create data using random numbers
              data = pd.DataFrame(raw_data, columns=["D", "I", "G", "L", "S"])
              
# Define the Bayesian model structure using edges
              model = BayesianNetwork([('D', 'G'), ('I', 'G'), ('G', 'L'), ('I', 'S')])
              #----------------------Generate probabilities from data -------------------------------
              # Obtain the parameters (CPDs) by fitting the model to the data
              model.fit(data, estimator=MaximumLikelihoodEstimator)
              model.get_cpds()
              # Check the CPDs of different nodes
              for cpd in model.get_cpds():
                print("CPD of {variable}:".format(variable=cpd.variable))
                print(cpd)
              
On a higher level, we will not need to stick with a network structure that we lay down manually, which may not be the optimal structure. Such structures can be sought based on scores with methods provided by pgmpy like exhaustive search and hill climb method. In addition, structural learning can also be performed with constraint or hybrid (score and constraint). The following code shows the use of two different methods with scores.
import pandas as pd
              import numpy as np
              from pgmpy.estimators.StructureScore import BDeuScore, K2Score, BicScore
              from pgmpy.models import BayesianNetwork
              # Generate samples using random numbers: there are 3 variables, in which Z depends on X and Y
              data = pd.DataFrame(np.random.randint(0, 4, size=(5000, 2)), columns=list('XY'))
              data['Z'] = data['X'] + data['Y']
              bdeu = BDeuScore(data, equivalent_sample_size=5)
              k2 = K2Score(data)
              bic = BicScore(data)
              # Method 1: Exhaustive Search
              from pgmpy.estimators import ExhaustiveSearch
              es = ExhaustiveSearch(data, scoring_method=bic)
              best_model = es.estimate()
              print(best_model.edges())
              print("\nAll DAGs by score:")
              for score, dag in reversed(es.all_scores()):
                print(score, dag.edges())
              # Method 2: HillClimbSearch
              from pgmpy.estimators import HillClimbSearch
              hc = HillClimbSearch(data)
              best_model = hc.estimate(scoring_method=BicScsore(data))
              print(best_model.edges())
              

7.4. Bayesian Nonparametrics

7.4.1. Parametric vs. Nonparametric Models

Overview

Though much less common than the classification of supervised vs. unsupervised machine learning, parametric vs nonparametric has also been adopted to differentiate machine learning methods. The definitions of these two types of models stem from the mapping sought in most problem-solving processes: the mapping from the input x x xxx to the output y y yyy, which is the essence/goal of both AI and traditional engineering methods for problem-solving.
(7.38) y = f ( x ) (7.38) y = f ( x ) {:(7.38)y=f(x):}\begin{equation*} y=f(x) \tag{7.38} \end{equation*}(7.38)y=f(x)
This mapping in Eq. 7.38 can be instantiated by a math function or, more generally, as a model consisting of many


Enjoy and Build the AI World

Sample Code from AI Engineering

Cite the code in your publications

Linear Models